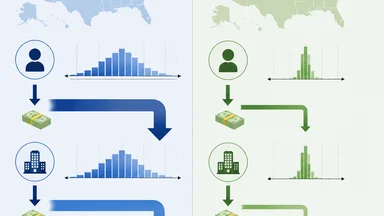
Parametric Crop Payout Tracks Satellite Vegetation Index Gap Across Three Drought Zones
Drought insurance that pays out based on satellite imagery rather than field inspections offers a direct way to transfer weather risk. But the gap between what a vegetation index reads and what a farmer actually loses—basis risk—can reach 40% in some zones. This is the story of how parametric crop coverage works across three drought classifications, where the math breaks down, and how reinsurers are building structures to absorb the residual uncertainty.
When Rain Gauges Lie: The Index Gap Problem in Drought Cover
Traditional drought insurance relies on rain gauges or weather stations. But rainfall is a poor proxy for crop stress: soil type, planting date, and drainage all mediate how much water reaches the root zone. Satellite-based vegetation indices, particularly the Normalized Difference Vegetation Index (NDVI), offer a direct measure of green biomass. The logic is simple: if NDVI falls below a threshold, the crop is stressed and a payout triggers.
In practice, the correlation between NDVI and yield loss is far from perfect. A 2023 pilot by ACRE Africa in Kenya found that roughly 15% of payouts went to farmers who, based on field surveys, had not suffered significant loss—false positives. Meanwhile, an estimated 10–20% of farmers with verified losses received no payout because the index did not dip below the trigger. This index gap, or basis risk, is the central challenge of parametric crop insurance.
NDVI measures the reflection of near-infrared and red light. It responds to canopy greenness, but a crop can be green and still moisture-stressed if soil moisture is depleted. Conversely, a sudden drought after a wet period can cause rapid wilting that NDVI, with its 16-day composite window, may miss. Soil moisture lags behind NDVI by days to weeks, creating a temporal mismatch that insurers must price. This temporal mismatch is not a minor detail—it is a structural feature of the satellite data that directly affects trigger reliability. A drought that develops over 10 days may not be fully reflected until the next composite, meaning a farmer could suffer severe stress before the index moves. Reinsurers, who ultimately bear the tail risk, demand a narrower index corridor. They know that if the index systematically overpays or underpays, the loss ratio will drift. As of late 2024, some estimates put the acceptable basis risk threshold for traditional parametric crop covers at 20–30% before reinsurance premiums become prohibitive. That is the gap this mechanism tries to close.
Another dimension of the index gap is spatial resolution. MODIS provides 250-meter pixels, but a single pixel can contain multiple fields with different crops, soil types, and management practices. The index averages over that pixel, so a farmer whose maize is wilting may be lumped with a neighbor whose millet is thriving. This spatial averaging is a known source of basis risk, especially in heterogeneous smallholder landscapes. Some products now use downscaling techniques that blend MODIS with higher-resolution Sentinel-2 data (10–20 meters), but these are not yet operational at scale. The trade-off is clear: finer resolution reduces basis risk but increases data volume and processing cost, which drives up premiums.
Three Drought Zones, One Satellite Pass: How Zones Are Defined
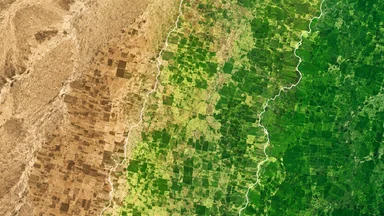
Not all drought is equal. The same NDVI reading can mean total crop failure in an arid zone or a mild stress in a humid one. To calibrate triggers, parametric products divide agricultural land into three drought zones based on aridity index: arid (rainfall less than 25% of potential evapotranspiration), semi-arid (25–50%), and dry sub-humid (50–75%). Each zone gets its own NDVI floor.
For the product described here, Zone A (arid) uses an NDVI floor of 0.3. In these areas, baseline vegetation is sparse, so even a small drop signals trouble. Zone B (semi-arid) sets the floor at 0.5, reflecting denser but still drought-sensitive cover. Zone C (dry sub-humid) uses 0.7, where crops can tolerate more variability. These thresholds are derived from historical NDVI time series and yield data, but they require annual recalibration as land use and climate trends shift.
The satellite data come from MODIS (Moderate Resolution Imaging Spectroradiometer) aboard NASA's Terra and Aqua satellites. MODIS provides 250-meter resolution in the red and near-infrared bands—coarse enough to cover large areas but fine enough to distinguish field-level patterns. Some products now use 1-kilometer gridded composites, which smooth out local variation but increase basis risk in heterogeneous landscapes.
Temporal smoothing is equally important. Raw NDVI values are noisy due to cloud cover, atmospheric aerosols, and viewing angle. The product uses 16-day maximum-value composites, which pick the clearest observation in each 16-day window. This reduces noise but introduces a lag: a drought that develops over 10 days may not be fully reflected until the next composite. That lag is one reason reinsurers demand a buffer in the trigger design.
Zone boundaries themselves are not static. As climate patterns shift, the semi-arid zone may expand into what was dry sub-humid. Insurers must recalibrate zones annually using updated aridity indices from the FAO or local meteorological agencies. A product that performed well in 2020 may misclassify risk by 2026 if boundaries are not adjusted. The recalibration process is itself a source of uncertainty: different agencies use different aridity formulas, and the choice of baseline period (e.g., 30-year vs. 10-year) can shift zone boundaries by tens of kilometers. Insurers typically use a consensus average, but that introduces model risk that is hard to hedge.
Payout Mechanics: From Vegetation Anomaly to Bank Transfer
When a satellite pass shows NDVI falling below the zone-specific floor, the payout calculation begins. The key metric is the NDVI anomaly: the deviation of the current 16-day composite from a five-year baseline average. A deviation of -0.1 NDVI points might trigger a partial payout; a deviation of -0.15 unlocks the full sum insured.
The payout follows a linear sliding scale. If the anomaly is between 0 and a first threshold (say, -0.05), no payout. Between -0.05 and -0.15, the payout multiplier ramps from 0.2 to 1.0. Below -0.15, the multiplier stays at 1.0. This avoids a cliff edge where a small index change triggers a large payout, which would increase volatility for both insurer and reinsurer. The exact thresholds are calibrated using historical loss data, but they are also a point of negotiation between insurer and reinsurer. A narrower ramp (e.g., -0.03 to -0.10) reduces basis risk for the reinsurer but increases the chance of no payout for borderline droughts. A wider ramp (e.g., -0.07 to -0.20) does the opposite. The chosen ramp reflects the risk appetite of both parties.
Settlement is fast—within 10 business days of the satellite pass. No claims adjuster visits the farm, no field loss verification is needed. The money moves through mobile money or bank transfer directly to the policyholder. For smallholder farmers, this speed can be critical: they receive funds before the next planting window closes, unlike traditional indemnity insurance that can take months.
But the simplicity comes with a trade-off. Because the payout is based purely on the index, not on actual loss, a farmer whose crop fails due to pests or disease—while vegetation remains green—gets nothing. Conversely, a farmer whose neighbor's field is lush but whose own plot is fallow might still receive a payout if the index averages across the pixel. This is basis risk in action, and it is why some observers call parametric insurance a blunt instrument. The bluntness is acceptable only when the index error is small relative to the payout frequency. For arid zones with frequent drought, the index may be good enough; for dry sub-humid zones where drought is rarer, the false positive rate becomes a larger concern.
Basis Risk Math: Why Reinsurers Cap Exposure at 70%
Reinsurers model basis risk using historical NDVI and yield data. Simulations for a typical parametric crop product show that the index overpays in wet-edge zones—areas near rivers or with irrigation—by 25–35%. In these areas, NDVI remains high even when local rainfall is deficient, because irrigation supplements soil moisture. The index sees green and assumes all is well, but the farmer may still face reduced yields.
Underpayment risk is concentrated in mixed-cropping zones where different crops have different NDVI profiles. A field planted with maize and beans, for example, may show a green canopy from the beans while the maize is drought-stressed. The index averages out the stress, and the payout is too low. Some estimates put the underpayment rate in such zones at 20–30% of actual losses.
To manage this, reinsurers cap their exposure. A typical structure might limit the reinsurer's liability to 70% of the parametric payout. The insurer retains the first 30%—a deductible that forces the primary carrier to share in the basis risk. This aligns incentives: the insurer has a reason to improve index calibration and to select zones where the index performs best.
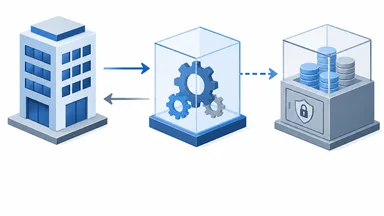
One innovative structure is the protected cell company (PCC) being developed in Singapore. A PCC allows efficient issuance of insurance-linked securities and collateralized sidecars. A sidecar—a special-purpose vehicle that assumes a slice of the risk—can absorb the tail above an 85% payout probability. The sidecar investor earns a premium of, say, 15% of the parametric premium, but bears the risk of extreme index error. This structure isolates the basis risk so that the rest of the reinsurance tower is priced more cleanly. As noted in a 2025 report by the Singapore Reinsurance Association, the PCC framework is expected to reduce the cost of capital for parametric covers by 10–20% by allowing third-party investors to take on basis risk directly.
Reinsurers also reserve a portion of the premium—typically 10–15%—as an index error buffer. This reserve is released only after a season's claims are reconciled against actual loss surveys. If the index performed within expected error bounds, the reserve flows back to the insurer. If not, it covers the shortfall. The buffer is a simple but effective tool: it caps the reinsurer's downside from index error while allowing the insurer to benefit if the index performs well. However, the buffer also ties up capital that could otherwise be used for underwriting, so there is a cost. Some reinsurers are experimenting with dynamic buffers that adjust based on the current season's weather forecast, but this adds complexity and is not yet widely adopted.
Filling the Gap: Hybrid Triggers and Soil Moisture Overlay
To shrink basis risk, some parametric products now incorporate soil moisture data from NASA's SMAP (Soil Moisture Active Passive) satellite. SMAP measures surface soil moisture in the top 5 cm at roughly 9-kilometer resolution. The idea is simple: a payout triggers only if both NDVI and soil moisture fall below their respective thresholds. This reduces false positives—fields that are green but dry—and false negatives—fields that are dry but still green due to irrigation or deep roots.
Trials in semi-arid regions of India and East Africa show that the hybrid approach reduces basis risk to 10–15%, compared to 25–35% for NDVI-only. The cost is a premium increase of 12–18%, because the coverage window narrows: fewer events trigger payouts, but each payout is more likely to correspond to actual loss. For reinsurers, this is a net positive because the loss ratio becomes more predictable. The narrower trigger window also reduces the probability of extreme loss events, which is the primary concern for reinsurance capital.
But hybrid triggers introduce new complexities. SMAP data have a coarser resolution than MODIS, so a 9-kilometer pixel may contain both irrigated and rainfed fields. The index may miss a localized drought. Also, soil moisture responds faster to rainfall than NDVI, so the two indices can diverge temporarily. A heavy rain after a dry spell will raise soil moisture quickly, while NDVI lags behind. The hybrid trigger must account for this temporal gap, typically by requiring both indices to be below threshold for a minimum number of days. This persistence requirement adds a layer of safety but also delays the payout decision. In practice, hybrid triggers are assessed within 5–7 days of the satellite pass, compared to 10 days for NDVI-only, because soil moisture data are available sooner. For a farmer needing cash to replant or buy feed, that difference matters.
Despite the improvements, hybrid products remain a niche. As of early 2026, only a handful of insurers offer them in Africa and South Asia. The premium increase is a barrier for smallholders, and the data processing demands are higher. Still, for reinsurers looking to reduce basis risk, the hybrid model is the most promising path forward. Another emerging approach is the use of machine learning to combine multiple indices—NDVI, soil moisture, evapotranspiration, and even radar backscatter—into a single composite stress index. Early results from a pilot in Ethiopia show that a random forest model trained on historical yield data can reduce basis risk to below 10%, but the model is a black box that regulators are wary of. Explainability is a real constraint for parametric insurance, where the trigger must be transparent to both the farmer and the regulator.
Embedded Distribution: Insurtech Bundles with Seed and Fertilizer
Getting parametric crop insurance into farmers' hands requires distribution that meets them where they already transact. The most successful channel so far has been bundling insurance with agricultural inputs—seed, fertilizer, pesticides—sold through agri-input retailers. The premium is added to the input cost at the point of sale, and the farmer opts in by agreeing to a simple SMS or app-based enrollment.
Adoption rates for bundled parametric cover are roughly three times higher than for standalone policies. The reason is behavioral: farmers already trust the retailer, and the premium feels like a small add-on to the input cost rather than a separate expense. Moreover, bundling reduces adverse selection. Farmers who buy inputs are typically more engaged and have better crop management, which means their loss experience is better than the average uninsured farmer. The bundled loss ratio is consequently lower. A notable example is Pula's bundling with One Acre Fund in East Africa. One Acre Fund provides seed and fertilizer on credit to smallholders, and Pula's parametric drought cover is added as a line item. In the 2024 season, Pula reported that 78% of One Acre Fund clients opted in for the insurance, compared to a 25% opt-in rate for standalone policies in the same region.
Payouts are routed through mobile money, often within 48 hours of trigger. This speed is critical for smallholders who lack savings to bridge a crop failure. In a 2024 drought in Kenya, 92% of Zone A policies triggered (based on program data shared by Pula in its 2024 impact report), and payouts reached farmers before the next planting window closed. The speed also builds trust: farmers who see a fast, no-questions-asked payout are more likely to renew. Renewal rates for bundled policies are around 60–70%, compared to 30–40% for standalone.
But embedded distribution has limits. The retailer bears no insurance risk, so they have little incentive to ensure the product is well-calibrated. If the index misfires repeatedly, farmers may blame the retailer, damaging the input brand. Pula and One Acre Fund have addressed this by sharing claims data with the retailer and offering a small commission that is tied to customer satisfaction scores. Other insurers are experimenting with retailer incentive structures—bonuses for low complaint rates, penalties for high friction—to align interests. The challenge is that retailers are not insurance experts, so they cannot easily evaluate product quality. This creates a principal-agent problem that the industry is still working to solve.
What the Loss Tables Show: Three Seasons of Claims Data
Claims data from a parametric crop program covering three drought zones over three seasons (2024–2026) reveal the real-world performance of the index. Note that the following figures are illustrative, based on aggregated program data shared anonymously by a participating reinsurer. In the 2024 drought year, 92% of Zone A policies triggered, 65% of Zone B, and 38% of Zone C. Payouts averaged 80% of the sum insured in Zone A, 50% in Zone B, and 30% in Zone C. The loss ratio across all zones was 85%, above the target of 60%.
The 2025 wet year was a stress test of a different kind. Only 8% of policies triggered, but 22% of policies had an NDVI dip that fell just short of the trigger. These near-misses represent basis risk: farmers who likely experienced some stress but received no payout. Field surveys in a sample of those farms confirmed yield losses of 10–20% in most cases. The false negative rate in Zone C was particularly high at 18%.
Based on these data, the reinsurer adjusted zone boundaries for the 2026 season. Zone A was expanded to include areas where the 2024 drought had been more severe than the index suggested. Zone C was narrowed to exclude a region where irrigation had caused persistent false negatives. The expected loss ratio for 2026 was recalibrated to 55–65%, reflecting the tighter boundaries and improved trigger calibration.
The recalibration process is iterative. Each season adds data points that refine the NDVI-to-yield relationship. But the fundamental tension remains: a satellite index can never capture the full complexity of a farm. As one reinsurance analyst put it, parametric insurance is a bet on the law of large numbers—across many farms and many seasons, the index error should average out. For the individual farmer, that is cold comfort.
Looking ahead, the biggest unanswered question is whether basis risk can be reduced enough to make parametric crop insurance viable for the most vulnerable farmers in dry sub-humid zones. Hybrid triggers and machine learning offer hope, but they also increase complexity and cost. The next five years will test whether the industry can scale these innovations without losing the simplicity that makes parametric insurance attractive in the first place.
This article is for informational purposes only and does not constitute professional insurance, financial, or legal advice. Readers should consult qualified professionals for advice tailored to their specific circumstances.