Homeowners Premium Calculated Through Roof Age and Wildfire Risk Lag
Your homeowners insurance premium is not a random number. It is the product of a complex engine that weighs hundreds of variables, but two inputs have grown disproportionately powerful: the age of your roof and the wildfire risk surrounding your property. Understanding how these factors interact can help you make smarter decisions about coverage and perhaps save money.
Why Your Roof Age Costs More Than You Think
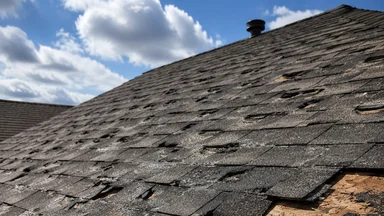
Roof age is one of the strongest signals an insurer uses to estimate future claim costs. A roof that is fifteen years old is far more likely to leak, lose shingles, or collapse under hail than one installed last year. Carriers apply depreciation schedules that vary by state. In Florida, for example, a roof beyond ten years may be written on an actual cash value basis, meaning the payout for a claim is reduced by accumulated wear and tear. In Colorado, some insurers refuse to write policies for roofs older than twenty years unless the homeowner provides an inspection certificate.
The reason roof age matters so much is simple: roof replacements are expensive. A new asphalt shingle roof can cost between US$ 8,000 and US$ 15,000 for a typical single-family home, and insurers have been stung by a surge in weather-related claims. Hail storms in Texas, tornadoes in the Midwest, and hurricanes along the Gulf Coast have all driven up loss ratios. Carriers responded by tightening underwriting guidelines. Many now use satellite imagery to verify roof condition from above, bypassing the need for an on-site inspection. If the satellite shows worn or missing shingles, the insurer may decline coverage or demand a replacement within sixty days.
Depreciation schedules are not uniform. In states with heavy storm activity, regulators have allowed carriers to accelerate depreciation so that older roofs are valued at a fraction of replacement cost. This is a trade-off: lower premiums for the homeowner today, but a much smaller check if a claim occurs. Some consumer advocates argue that actual cash value policies leave homeowners underinsured, especially if they lack the savings to cover the gap. Carriers counter that the pricing reflects the true risk, and that forcing all homeowners to carry replacement cost coverage would raise premiums for everyone.
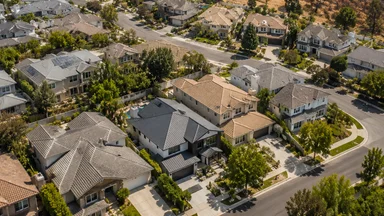
Satellite imagery has made roof age verification nearly automatic. Companies like Geospace Analytics and EagleView provide insurers with detailed reports showing roof material, condition, and estimated remaining life. This data is fed directly into rating engines, often within days of a policy quote. Homeowners may not realize that a roof that looks fine from the ground can appear worn from above. The result is that roof age is no longer a subjective judgment by an agent; it is a hard data point that can trigger rate increases or non-renewal.
Wildfire Risk Data That Moves Premiums
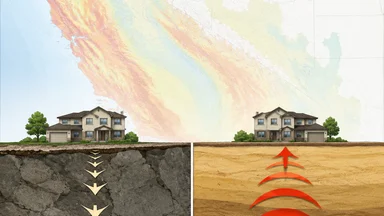
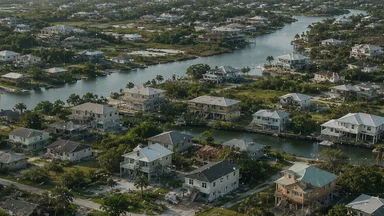
Wildfire risk has become a dominant factor in homeowners pricing across the western United States. Insurers now use proprietary models that combine public data from agencies like the U.S. Forest Service with their own loss history to assign a wildfire risk score to every property. These models consider vegetation density, slope steepness, prevailing wind patterns, and the distance to recent fire perimeters. A home on a steep slope with dense brush within thirty feet is rated far higher than one in a flat, cleared lot.
Fire weather frequency is another input that has gained weight. Carriers track the number of days per year when temperature, humidity, and wind conditions align to create extreme fire danger. Areas with a rising trend in such days see premiums climb even if no fire has occurred nearby. The logic is that the potential for loss is increasing, and insurance is about pricing that potential, not just past losses. The Risk Factor model from the First Street Foundation, for instance, incorporates fire weather frequency alongside other variables to produce property-level risk scores. A home within five miles of a fully staffed station may receive a modest discount, while a remote property with a thirty-minute response time pays a surcharge.
Swiss Re's sigma report, published in mid-2026, noted that the non-life insurance market has entered a softer phase of the underwriting cycle but that the depth of the downturn is expected to be limited. This is partly because catastrophic losses from wildfires have not abated. The report signaled that carriers remain cautious about cutting rates aggressively in high-risk zones. For homeowners, this means that even if the broader market softens, wildfire-exposed properties may not see meaningful premium relief.
Proprietary models vary widely among carriers. One company might weight vegetation density heavily, while another places more emphasis on historical fire perimeters. This is why shopping around can yield dramatically different quotes for the same property. A homeowner with a metal roof and a cleared defensible space may find a carrier that specializes in wildfire risk and offers a competitive rate, while a traditional carrier using a broad-brush model might charge double. The divergence is a symptom of an industry still refining its approach to wildfire modeling.
The Two-Year Lag Nobody Talks About
Homeowners premiums do not adjust instantly after a disaster. There is a structural lag of roughly eighteen months to two years between a major loss event and the resulting rate changes filtering down to individual policies. This lag has several causes. First, insurers need time to compile and validate loss data. A wildfire in October may not produce final claim tallies until the following summer. Second, reinsurance contracts are typically negotiated annually, and the pricing of that reinsurance—which directly affects primary carriers' costs—takes effect on renewal dates. If a catastrophe occurs in the middle of a contract year, the full impact is not felt until the next renewal cycle.
Regulatory approval is another source of delay. In many states, rate changes must be filed and approved by the insurance department, a process that can take six months or more. During that time, the carrier is absorbing higher costs from claims and reinsurance without being able to raise premiums. This creates pressure to front-load rate increases once approval is granted, which is why homeowners sometimes see large jumps after a quiet year.
Catastrophe model updates also lag. The models used by carriers to project future losses are updated periodically, often annually, based on new scientific data and historical events. If a wildfire season shatters previous records, the model may not incorporate that information until the next version is released. This means premiums in the immediate aftermath of a disaster may not fully reflect the elevated risk. Conversely, if no fires occur for a few years, models may gradually reduce risk scores, leading to lower rates—even if the underlying hazard remains unchanged.
Artemis.bm, a publication covering insurance-linked securities, reported that the depth of the non-life soft market downturn is expected to be more limited this time, according to Swiss Re. This suggests that the lag, while real, may not lead to the steep rate cuts seen in previous cycles. Carriers are wary of repeating past mistakes where they underpriced risk and then suffered heavy losses. The lag is a structural feature of the industry, but its duration may shrink as real-time data sources become more prevalent.
How Insurers Combine Roof and Fire Inputs
The rating engine that determines your premium does not treat roof age and wildfire risk as independent factors. Instead, they are combined in a tiered scoring system that can amplify or offset each other. For example, a home with a new Class A fire-rated roof in a moderate wildfire zone may receive a discount on the wildfire component because the roof itself reduces ignition risk. On the other hand, an older wood-shake roof in the same zone would be scored harshly on both inputs, leading to a premium that is more than the sum of its parts.
Credit-based insurance scores also interact with these factors. In most states, insurers use credit history as a predictor of claim likelihood. A homeowner with excellent credit may qualify for a lower base rate, but the roof and wildfire surcharges are applied on top of that base. The credit score does not erase the physical risk; it simply adjusts the starting point. Similarly, claim history plays a role. A single claim for wind damage can trigger a multiplier that increases the premium for several years, especially if the claim involved the roof.
Quote engines run hundreds of variables in real time. When you enter your address, the system pulls data from public records, satellite imagery, and third-party databases. It calculates the roof age from permit records or imagery, assigns a wildfire risk score from a model like Zillow's wildfire risk layer or Risk Factor, and then applies the carrier's proprietary algorithms. The entire process takes seconds, but the complexity is immense. Carriers guard these algorithms as trade secrets, which makes it difficult for consumers to understand exactly why their premium is what it is.
One emerging trend is the use of parametric triggers for wildfire coverage. Instead of indemnifying actual losses, some carriers offer a fixed payout when a fire reaches a certain proximity. These products simplify underwriting but also shift risk back to the homeowner. They are not yet widespread, but they represent an alternative to the traditional combined model. For now, most homeowners are still in the standard system where roof and fire inputs are the dominant drivers.
What Homeowners Can Actually Control
Despite the complexity, there are concrete steps homeowners can take to influence their premium. The most impactful is replacing an old roof before shopping for insurance. A new roof, especially one made of fire-resistant materials like metal or tile, can reduce the roof-age surcharge to zero and may also lower the wildfire risk score. Some carriers offer discounts of 5 to 15 percent for Class A roofing. The upfront cost is significant, but it pays back over time through lower premiums and reduced risk of non-renewal.
Creating defensible space around the house is another controllable factor. Clearing dry vegetation, trimming trees, and using non-combustible landscaping materials can lower the wildfire risk score. Some insurers now offer discounts for homes that meet Firewise or similar standards. Documentation is key: a letter from a fire department or a certified inspector can help ensure the discount is applied. Homeowners should also check whether their carrier offers a discount for installing ember-resistant vents and dual-pane windows.
Bundling homeowners with auto insurance typically yields a small discount, usually 5 to 10 percent. However, this discount is applied to the base premium, not the surcharges, so it may not offset large roof or wildfire additions. Avoiding small claims is perhaps the most effective long-term strategy. Each claim stays on your record for three to five years and can increase your premium by 20 percent or more. Paying out-of-pocket for minor repairs keeps your claim history clean and prevents your roof age from being reassessed by an adjuster.
Finally, shopping around every year or two is essential. Because carriers weight roof age and wildfire risk differently, the same home can have very different premiums. An independent agent can help compare quotes from multiple companies. Homeowners should also review their policy declarations page to ensure the roof age and wildfire zone listed are accurate. If the carrier has incorrect data, a correction can lead to a lower premium. These steps are not guaranteed to produce savings, but they tilt the odds in the homeowner's favor.
Regulatory Shifts Reshaping the Formula
State regulators are increasingly intervening in how roof age and wildfire risk are used in pricing. California's FAIR Plan, the insurer of last resort, has expanded significantly as private carriers have pulled back from wildfire-prone areas. The plan now covers hundreds of thousands of homes, but premiums are high and coverage limits are low. In response, California regulators are pushing carriers to adopt forward-looking catastrophe models that account for climate change, rather than relying solely on historical data. This could lead to more accurate—and potentially higher—premiums for high-risk properties.
Colorado passed legislation requiring insurers to use a state-approved wildfire risk model developed by the University of Colorado. The model includes factors like building materials, defensible space, and local fire response capabilities. Carriers must justify any deviation from the model's recommendations. This has made pricing more transparent but also more uniform, reducing the ability of homeowners to shop for a better deal based on different model outputs. Some carriers have protested, arguing that the model does not capture all relevant risk factors.
Florida, meanwhile, has imposed caps on roof depreciation. A 2024 law limits insurers from applying depreciation to roofs less than ten years old, and requires that any depreciation schedule be clearly disclosed. This was a response to widespread complaints from homeowners who discovered their roof coverage was far less than expected after a storm. The cap has stabilized premiums for some homeowners but has led others to see increases as carriers offset the reduced depreciation with higher base rates.
An interstate compact for rate filings is under discussion among western states. The idea is to streamline the approval process for rate changes that reflect wildfire risk, reducing the lag between loss events and premium adjustments. Consumer advocates worry that faster approvals could lead to rate hikes that outpace homeowners' ability to adapt. The tension between accuracy and affordability is likely to shape regulatory debates for years to come. For now, the patchwork of state rules means that where you live heavily influences how your premium is calculated.
The Limits of Smart Pricing
Homeowners insurance pricing has moved away from broad averages and toward granular, property-specific data. Roof age and wildfire risk are two of the most powerful inputs, and they are becoming more precise with each passing year. Satellite imagery, public records, and proprietary models now combine to produce a premium that reflects the unique characteristics of your home. This is fairer in theory, but it also means that homeowners who neglect maintenance or live in high-risk areas face steeper costs.
Yet smart pricing has blind spots. The same models that reward a new roof and cleared brush can penalize homeowners for factors beyond their control, such as a neighbor's unkempt lot or a regional drought that elevates fire risk scores. Moreover, the reliance on proprietary algorithms means errors are hard to catch. A satellite image that misclassifies a metal roof as asphalt, or a fire risk model that overweights a single dry season, can inflate premiums for years until the data is corrected. Homeowners who challenge their rates often face an opaque appeals process.
Market softness, as noted by Swiss Re, will not erase underlying risk. Even if competition leads to lower rates in some areas, the fundamental drivers of roof age and wildfire exposure will persist. But the promise of precision has a downside: it can create a two-tier market where low-risk homes enjoy falling premiums while high-risk homes face escalating costs, with little middle ground. This dynamic may accelerate the flight of private capital from wildfire-prone zones, leaving more homeowners dependent on FAIR Plans that offer thin coverage at high prices.
The lag between losses and rate changes will likely shrink as real-time sensors and faster data sharing become standard. Some carriers are experimenting with telematics for homes, similar to usage-based auto insurance, to monitor for leaks, smoke, or structural stress. These innovations could eventually allow premiums to adjust continuously, but they also raise privacy concerns. For now, the two-year lag remains a feature of the system, and homeowners should not expect immediate relief after a quiet fire season.
Understanding how your premium is calculated is the first step toward managing it. Check your roof age and wildfire zone at least once a year. Verify that your insurer has accurate data. And remember that insurance is a tool for transferring risk, not a reward for good behavior. The smarter pricing models are here to stay, and the best strategy is to align your home's risk profile with the data carriers use to set rates.
This article provides general informational content and does not constitute personalized insurance advice. Coverage needs vary by individual circumstances. Consult a licensed insurance professional to evaluate your specific situation.